We want to transform our initial state into the target state. At each move, we only have a few options to transform our state achieved so far into a similar or "adjacent" state. A "map" displaying all states and adjacencies between them might be handy if we want to get advice about which direction to move. Such a map is the so-called "state graph".
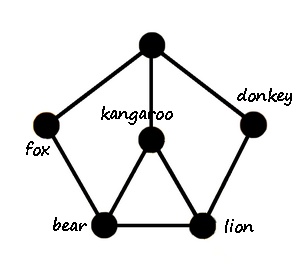
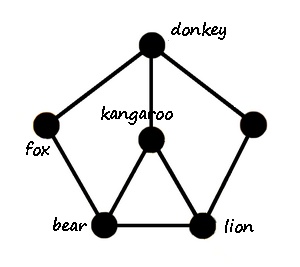
The state graph has all states as vertices. Two such states are adjacent of one can be transformed into the other by just one move. Meaning that both states have identical labels at the vertices of the underlying graph (or cage graph), except for two adjacent vertices x and y with x labeled by L and y unlabeled in one state and y labeled by L and x unlabeled in the other state. As in the two states shown below.
Remember that the state graph (not the states themselves, not the underlying graph (cage graph), but the graph having all states as vertices) is usually very large. In our two examples: the state graph of the animal example has 720 vertices, and the state graph of the 15 puzzle has 1,307,674,368,000 vertices. Unfortunately these state graphs are too large to draw. They are like huge maps that you cannot unforl but just look at locally.