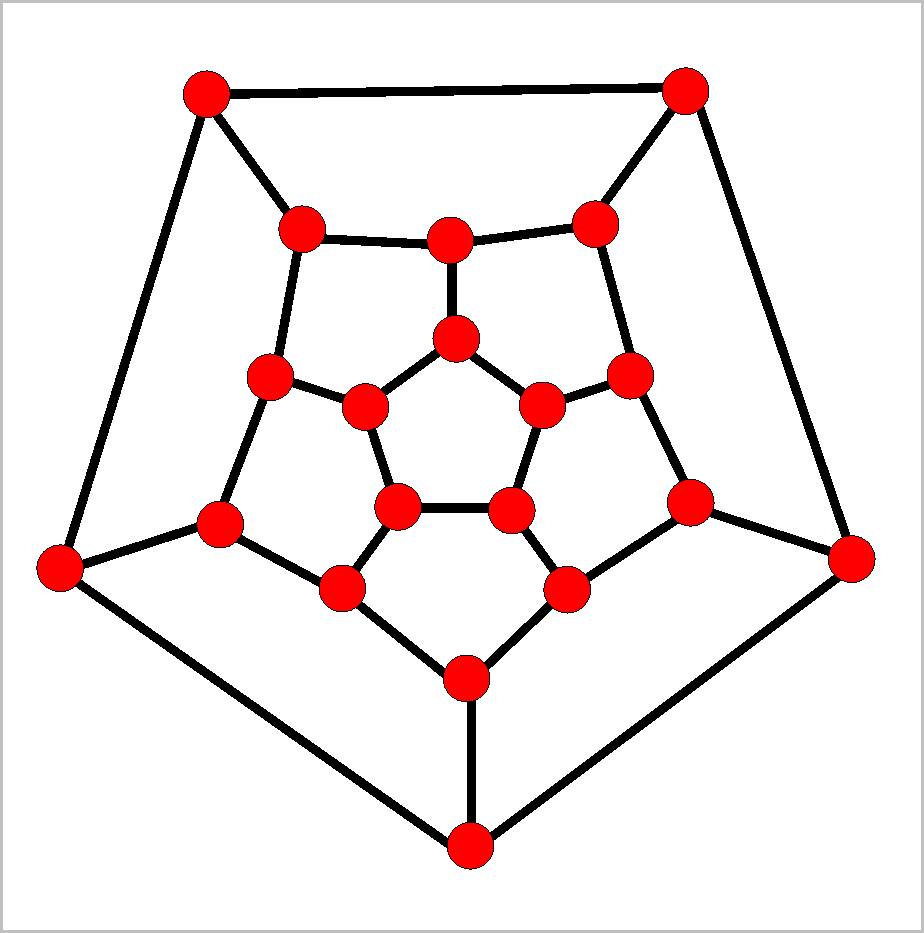

 Graphs in Mathematics could be graphs of functions or equations,
but they could also be something like in the examples.
These other graphs visualize
some symmetric "relation" between items. The items are called vertices.
They are visualized by small circles (or squares, or rectangles).
If two items are related or adjacent, then the vertices are connected by a
straight (or also curved) line, which is called the edge between these
vertices, or the edge connecting these vertices. The edge is called incident
with the two vertices it connects.
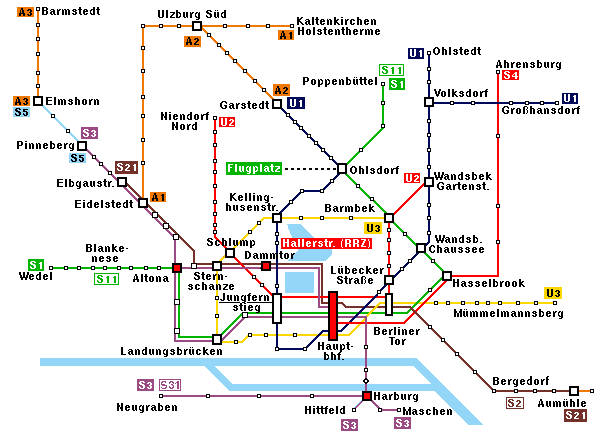
The first example is a map of Hamburg's subway system. The subway stations are the vertices. Two stations are adjacent, connected by a line, if there is a direct subway connection between them. Note that even in cases like this, the graph is not geometrically right. Subway lines are usually drawn by straight lines, and also the location of the vertices is not geometrically correct.
| In the second example the vertices are different German 4-letter-words, and two words are adjacent if they differ in only one letter. |
 |
| In the third example, the vertices are the airports in Germany, and two such vertices are adjacent if there is a direct "Air Berlin" flight between them. |  |
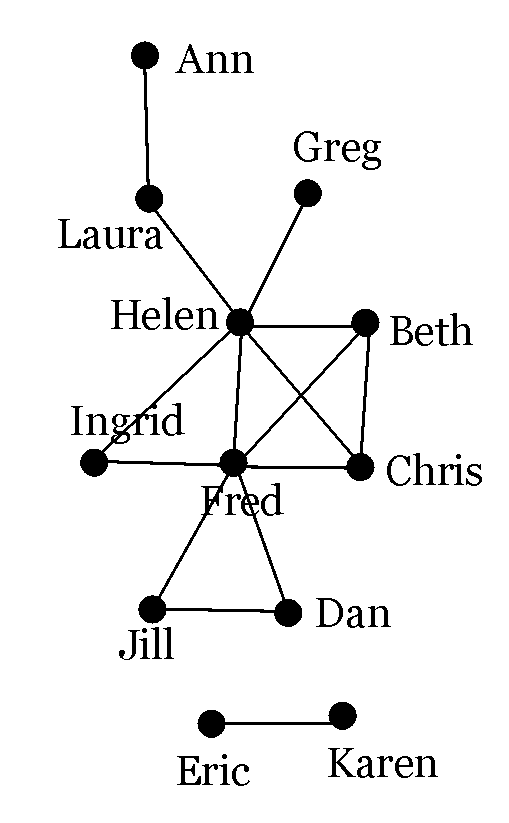 The next example is a social network. The vertices are persons, and they are adjacent if they
are friends. These graphs can be used to reveal interesting properties, for instance
it reveals immediately that Helen and Fred are very popular, that Eric and Karen are somewhat isolated,
that Helen, Fred, Beth, and Chris form a "clique", but Helen and Fred are also part of another clique
together with Ingrid (and there is also another clique consisting of Fred, Jill, and Dan).
We could also form a different one, where vertices are adjacent if the persons just know each other, but knowing each other is not symmetric. I know Angela Merkel (at least I know of her), but she doesn't know me.
There are also other types of social networks possible. Assume we define a graph whose vertices are all Franklin College students. Two such vertices/students are adjacent if they have a common class in this spring semester.
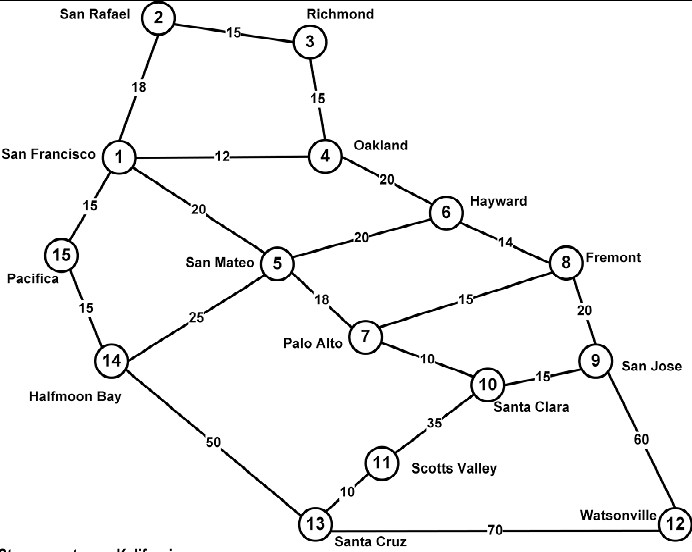
 The next example is a graph of some cities in California, and major highways between them.
Again in this way the graph is not supposed to be geometrically correct. Note also that the
lengths of the highways, of the edges, is displayed at the edge.
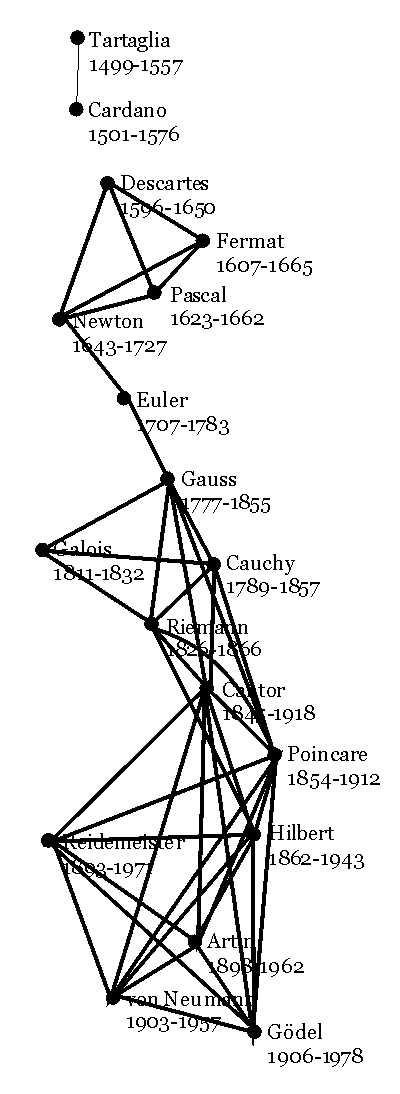
The next example has some mathematicians as vertices. Two such vertices are adjacent whenever the mathematicians had some common time living, i.e. if both life times overlap.
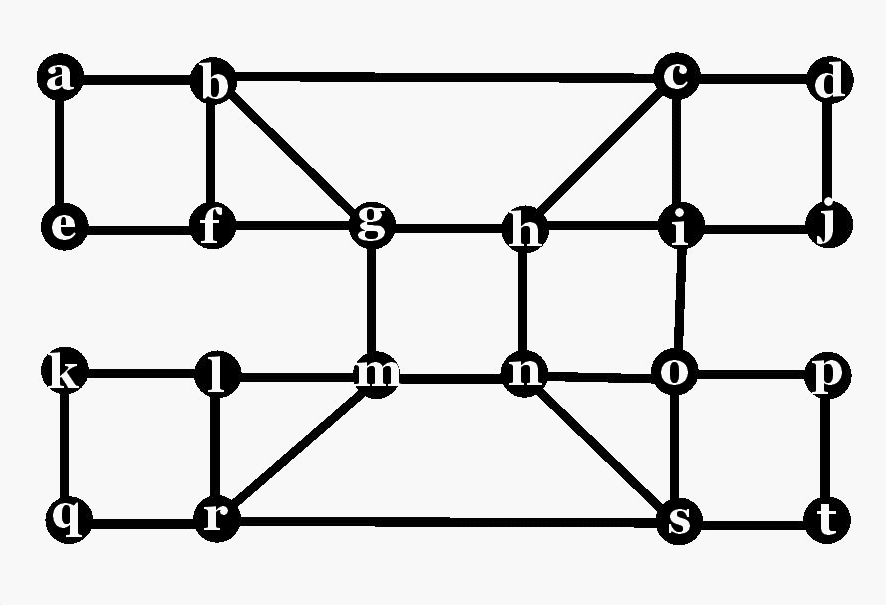 The degree of a vertex x, d(x), is the number
of edges x is incident with. Obviously it is also the number of vertices
the vertex x is adjacent with. In the example to the right, vertex a has degree 2,
vertex b has degree 4, and vertex f has degree 3. d(a)=2, d(b)=4, d(f)=3.
A tour is a sequence x1,x2,x3,x4,...xn of vertices, where any two consecutove vertices xk and xk+1 are adjacent. So we start at some vertex x1 and move over edges until we eventually arrive at vertex xn. Such a tour with frist vertex x1 and last vertex xn is also called a x1-xn tour. Note that vertices, even edges, can be visited repeatedly in a tour. If every vertex is visited at most once, we call the tour a path. In the example to the right, a,b,g,m,n,h,g,f,b,c,i,h,g is a tour but not a path. On the other hand, the tour a,b,g,m,n,o,p,t,s is a path. A graph is connected if every two vertices can be joined by a tour.
Let us introduce two more definitions: Distance and diameter. The distance d(x,y) between two vertices x, y is the length of a shortest path (measured in number of edges). In the above example, d(f,o) = 4, and d(f,c)=3. The distance is called infinite if there is no path between the corresponding vertices. The diameter diam(G) of a connected graphj is the largest occuring distance in that graph. That means, the distance between any two vertices in the graph is at most diam(G), but there must be a pair of vertices x and y having distance d(x,y)=diam(G), extreme cases, vertices that are as far away as possible.
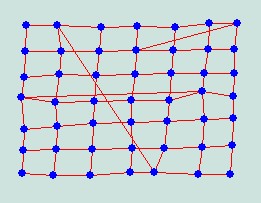
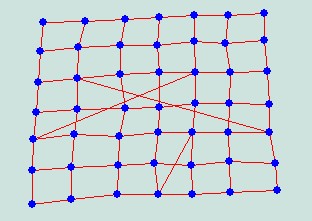
Obviously graphs with small degree could be expected to have a larger diameter than graphs with large degrees of their vertices, provided both have the same number of vertices. It is a well-known problem in applications to design graphs, with as many vertices as possible, where all vertices have a degree equal to a given number Δ or less, and whose diameter equals another fixed number D. The best graph for Δ=3 and D=2, with the degrees of all vertices 3 or less, and with diameter 3, is the so-called Petersen graph shown below to the left, with 10 vertices. To the right, the optimal (largest possible graph for Δ=3 and D=3 is shown.
 |  |
| Degree=3, diam=2 | degrees=3, diameter=3 |
For other cases, even simple ones, the "best" graphs are not known yet. For instance, for degrees 3 and diameter 4, several graphs with 41 vertices are known, but none with 42 vertices. If you find one, you get your first publication in Math!
 In the graph shown to the right, find a tour between x and y.
